
| species | island | bill_length_mm | bill_depth_mm | flipper_length_mm | body_mass_g | sex | year | |
|---|---|---|---|---|---|---|---|---|
| 0 | Adelie | Torgersen | 39.1 | 18.7 | 181.0 | 3750.0 | male | 2007 |
| 1 | Adelie | Torgersen | 39.5 | 17.4 | 186.0 | 3800.0 | female | 2007 |
| 2 | Adelie | Torgersen | 40.3 | 18.0 | 195.0 | 3250.0 | female | 2007 |
| 3 | Adelie | Torgersen | NaN | NaN | NaN | NaN | NaN | 2007 |
| 4 | Adelie | Torgersen | 36.7 | 19.3 | 193.0 | 3450.0 | female | 2007 |
Install Python. Quarto Render All the Things
PyData NYC 2022
Munsee Lenape

Daniel Chen
Postdoctoral Research and Teaching Fellow, UBC, MDS-Vancouver
Data Science Educator, Posit, PBC (Posit Academy)
Author, Pandas for Everyone
What is Quarto?


Let’s talk about Jupyter Notebooks…
Joel Grus JupyterCon 2018 “I don’t like notebooks”

Jeremy Howard “I like notebooks”

Quarto vs Jupyter


Quarto ➡️ Jupyter

fast.ai

Load - EDA - Plot - Model
from plotnine import ggplot, aes, geom_boxplot, theme_xkcd

(
  ggplot(
    data=penguins,
    mapping=aes(x="sex", y="body_mass_g", color="species")
  )
  + geom_boxplot()
  + theme_xkcd()
)
<ggplot: (327066350)>
Model Ops

Holistic MLOps for
Better Science
Create .qmd or .ipynb
Profit!

Shiny for Python!
“Interactive apps and dashboards made easy-ish”

Joe Cheng


(shivers) Happy Halloween, everybody🖤🧡🕷️🕸️ pic.twitter.com/jSYW5l7QJw
— Allison Horst (@allison_horst) October 31, 2022
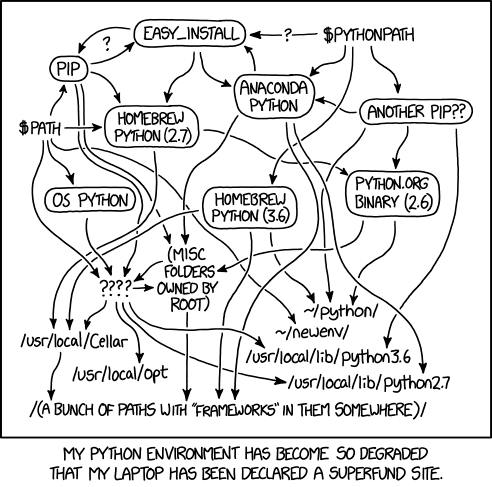
Python Setup

What can you do: Gallery

How can you do: Get Started + Guide

Share: Github
- Build from a branch
index.qmd

- Isabel’s slides repo + auto build: https://github.com/isabelizimm/pydata-nyc2022
Share: Quartopub
- https://quartopub.com/
quarto publish quarto-pub index.qmd
